The ice at Vostok: 420,000 years of air
Before the deep cores, the air of past ice ages could only be inferred; after Vostok, this civilization held a measured record of four glacial cycles against which to compare the air it was changing.
- Dated
- Place
- Vostok Station, East Antarctica · Soviet, then Russian, glaciologists and drillers at Vostok Station, working from 1993 in a joint Russian, French and American project with laboratories in Grenoble, Saint Petersburg and the United States
- Coordinates
- 78° 28′ S · 106° 50′ E (approximate)
- Remains
- Fragmentary
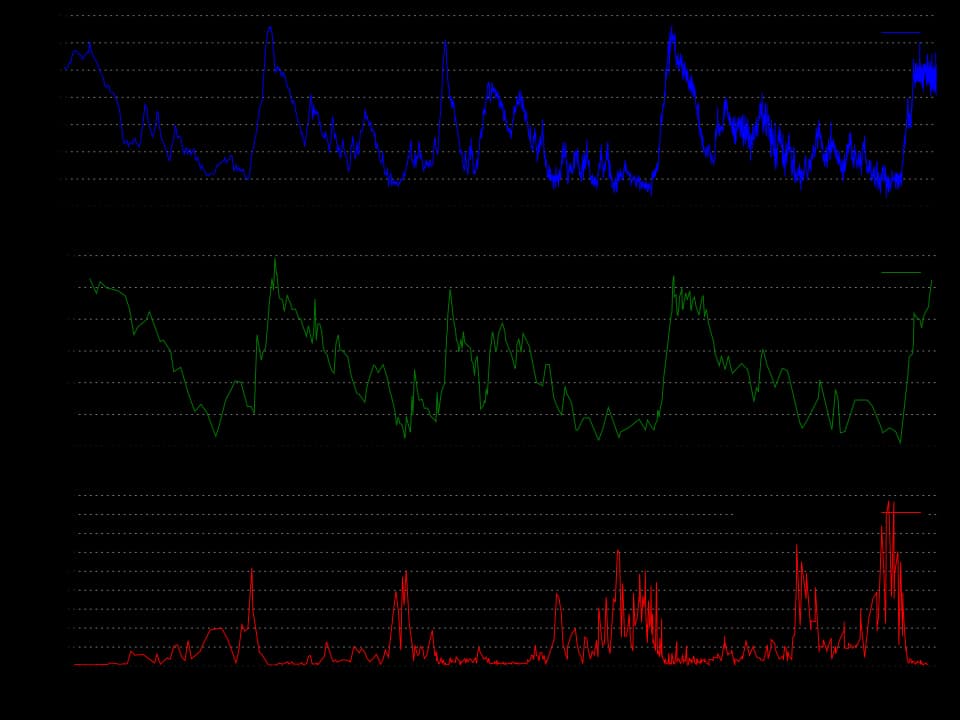

Autopilot, based on NOAA data (Petit et al. 1999), CC BY-SA 3.0, via Wikimedia CommonsCC-BY-SA-3.0Original record
Data saver is on. Images load only when you ask. You can change this in Settings at any time.
From the archivist
Snow that fell on the high plateau of East Antarctica never melted. Year after year it was pressed into ice, and each layer closed over a little of the air above it, in bubbles too small to see.
At Vostok, one of the coldest places on the planet, a drill went down into that ice through the 1990s: Soviet then Russian drillers, French and American scientists, a thin cylinder brought up metre by metre, cut, labelled, flown away in cold boxes. In January 1998 the drill stopped at 3,623 metres, a little above a lake sealed beneath the ice.
In the laboratories, the bubbles were opened and the air of vanished ages was measured. Over four ice ages and four warm spells, the carbon dioxide rose and fell in step with the temperature, never much above 300 parts per million.
This civilization then compared that archive with its own sky. In 2025 the air over Hawai'i held more than 427.
Established
- Vostok Station, founded by the Soviet Union on 16 December 1957, stands on the East Antarctic ice sheet; drilling of borehole 5G began on 20 February 1990 (Vasiliev et al. 2007).
- From August 1993 the coring and the study of the ice were carried out by a joint Russian, French and American project; in January 1998 the drill reached 3,623 metres, about 130 metres above the subglacial Lake Vostok, and was stopped (Vasiliev et al. 2007).
- In 1999 Petit and colleagues published in Nature a record covering the past 420,000 years, four glacial and interglacial cycles, measured from the air bubbles and the isotopes of the ice (Petit et al. 1999).
- Carbon dioxide and methane in the trapped air rose and fell with Antarctic temperature throughout the record; carbon dioxide stayed between about 180 and 300 parts per million (Petit et al. 1999; NOAA data archive).
- In 2025 the annual mean concentration of carbon dioxide measured at Mauna Loa, Hawai'i, was 427.35 parts per million (NOAA Global Monitoring Laboratory).
- The European EPICA core from Dome C extended the carbon dioxide record to 800,000 years in 2008 (Lüthi et al. 2008); in January 2025 the Beyond EPICA project reached bedrock at Little Dome C with ice it reports to be more than 1.2 million years old, whose analysis is under way (Beyond EPICA).
Interpretation
That carbon dioxide and temperature moved together is measured; which one led at each turn is a finer question. Ice core studies suggest that the orbital rhythms of the Earth set off the changes and that carbon dioxide then amplified them, and the order of events at the ends of ice ages is still refined. The record does not by itself forecast the future climate; what it establishes is that today's concentration lies well outside the range the ice holds for the past 420,000 years, and, with the later cores, for the past 800,000.
In 10,000 years
In 10,000 years, will someone drill into the ice again and find, in a thin layer of bubbles, the air of this century?
Sources (7)
- Petit, J. R., Jouzel, J., Raynaud, D., Barkov, N. I., Barnola, J.-M., Basile, I., Bender, M., Chappellaz, J., Davis, M., Delaygue, G., Delmotte, M., Kotlyakov, V. M., Legrand, M., Lipenkov, V. Y., Lorius, C., Pépin, L., Ritz, C., Saltzman, E., Stievenard, M. Climate and atmospheric history of the past 420,000 years from the Vostok ice core, Antarctica. Nature 399, 1999, p. 429-436. · doi.org
- Petit, J. R., et al. Vostok Ice Core Data for 420,000 Years. IGBP PAGES/World Data Center for Paleoclimatology Data Contribution Series 2001-076, NOAA Paleoclimatology Program, Boulder, 2001. · www.ncei.noaa.gov
- Vasiliev, N. I., Talalay, P. G., et al. Deep drilling at Vostok station, Antarctica: history and recent events. Annals of Glaciology 47, 2007, p. 10-23. · www.cambridge.org
- Lüthi, D., Le Floch, M., Bereiter, B., Blunier, T., Barnola, J.-M., Siegenthaler, U., Raynaud, D., Jouzel, J., Fischer, H., Kawamura, K., Stocker, T. F. High-resolution carbon dioxide concentration record 650,000-800,000 years before present. Nature 453, 2008, p. 379-382. · doi.org
- NOAA Global Monitoring Laboratory. Mauna Loa CO2 annual mean data (annual mean for 2025: 427.35 ppm; global marine surface annual mean: 425.62 ppm), consulted 28 September 2026. · gml.noaa.gov
- NSF Ice Core Facility. Vostok core inventory (cores 3G, 4G-2, 5G and shallow holes, 1981-1998). · icecores.org
- Beyond EPICA, Oldest Ice. Press releases (bedrock reached at Little Dome C, January 2025). · www.beyondepica.eu
Related fragments
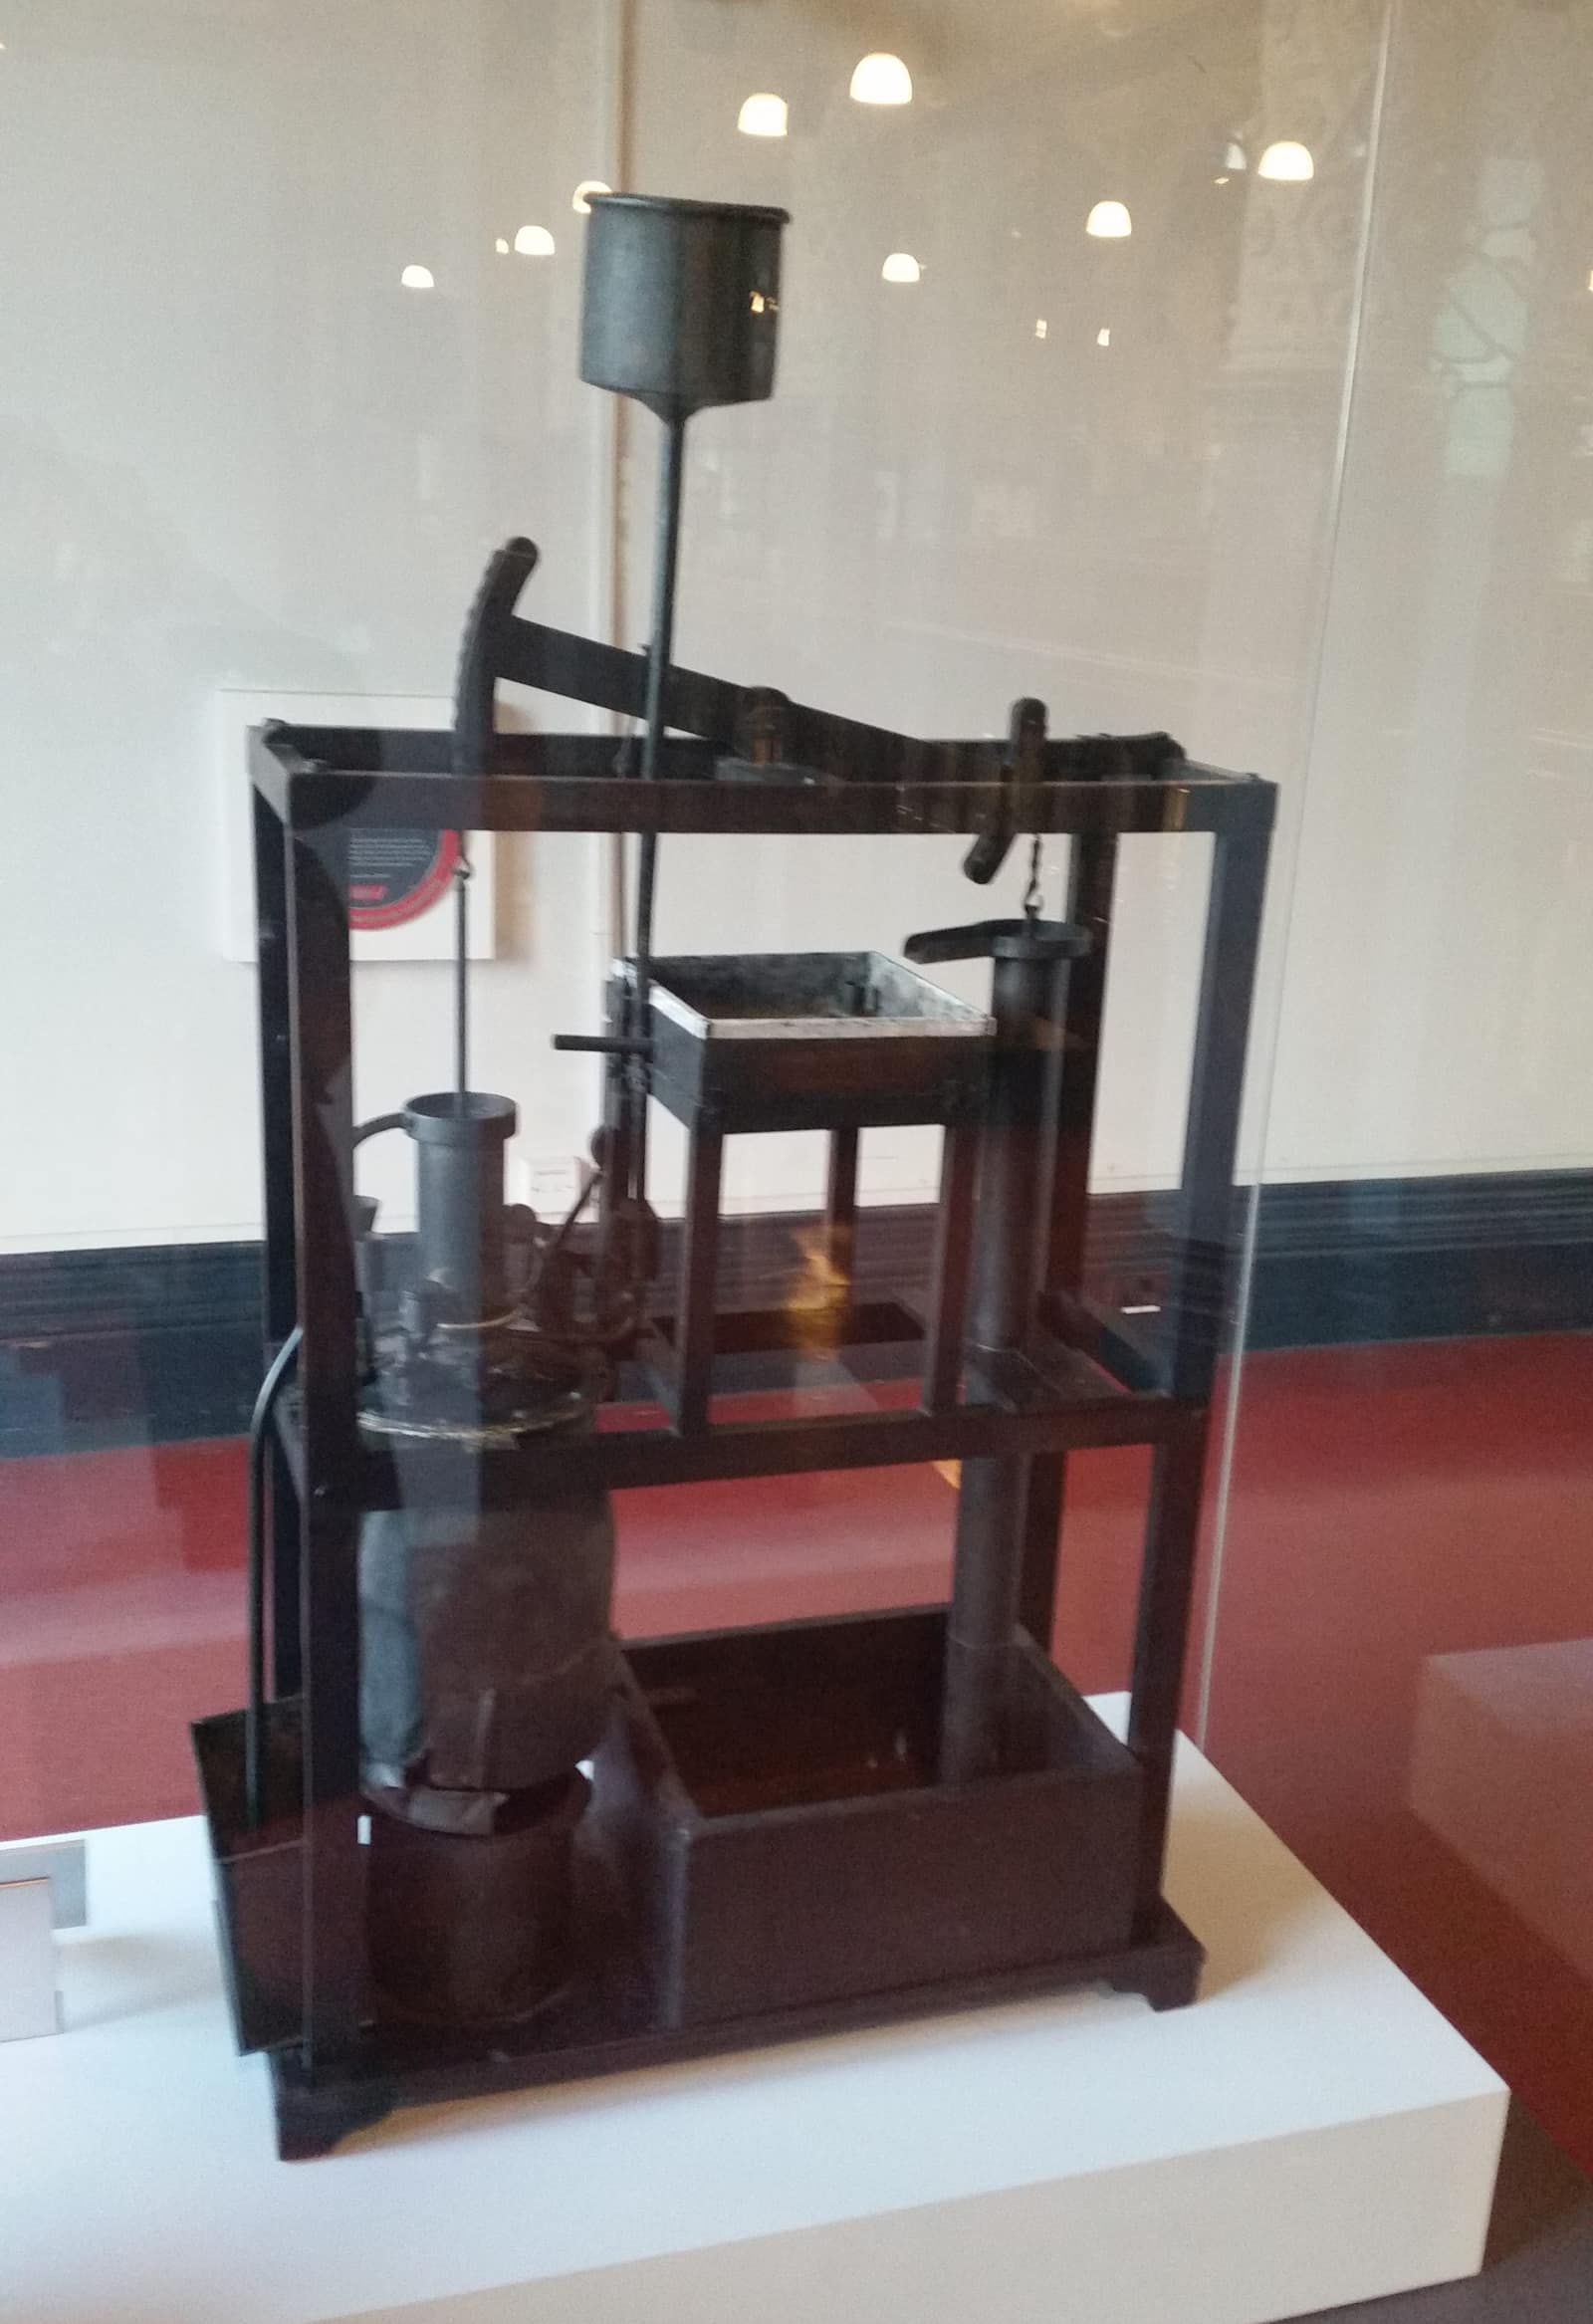
1712 to 1769
Fire made to work: from Newcomen's engine to Watt's condenser
Coneygree, Tipton, near Dudley, West Midlands, United Kingdom · Europe
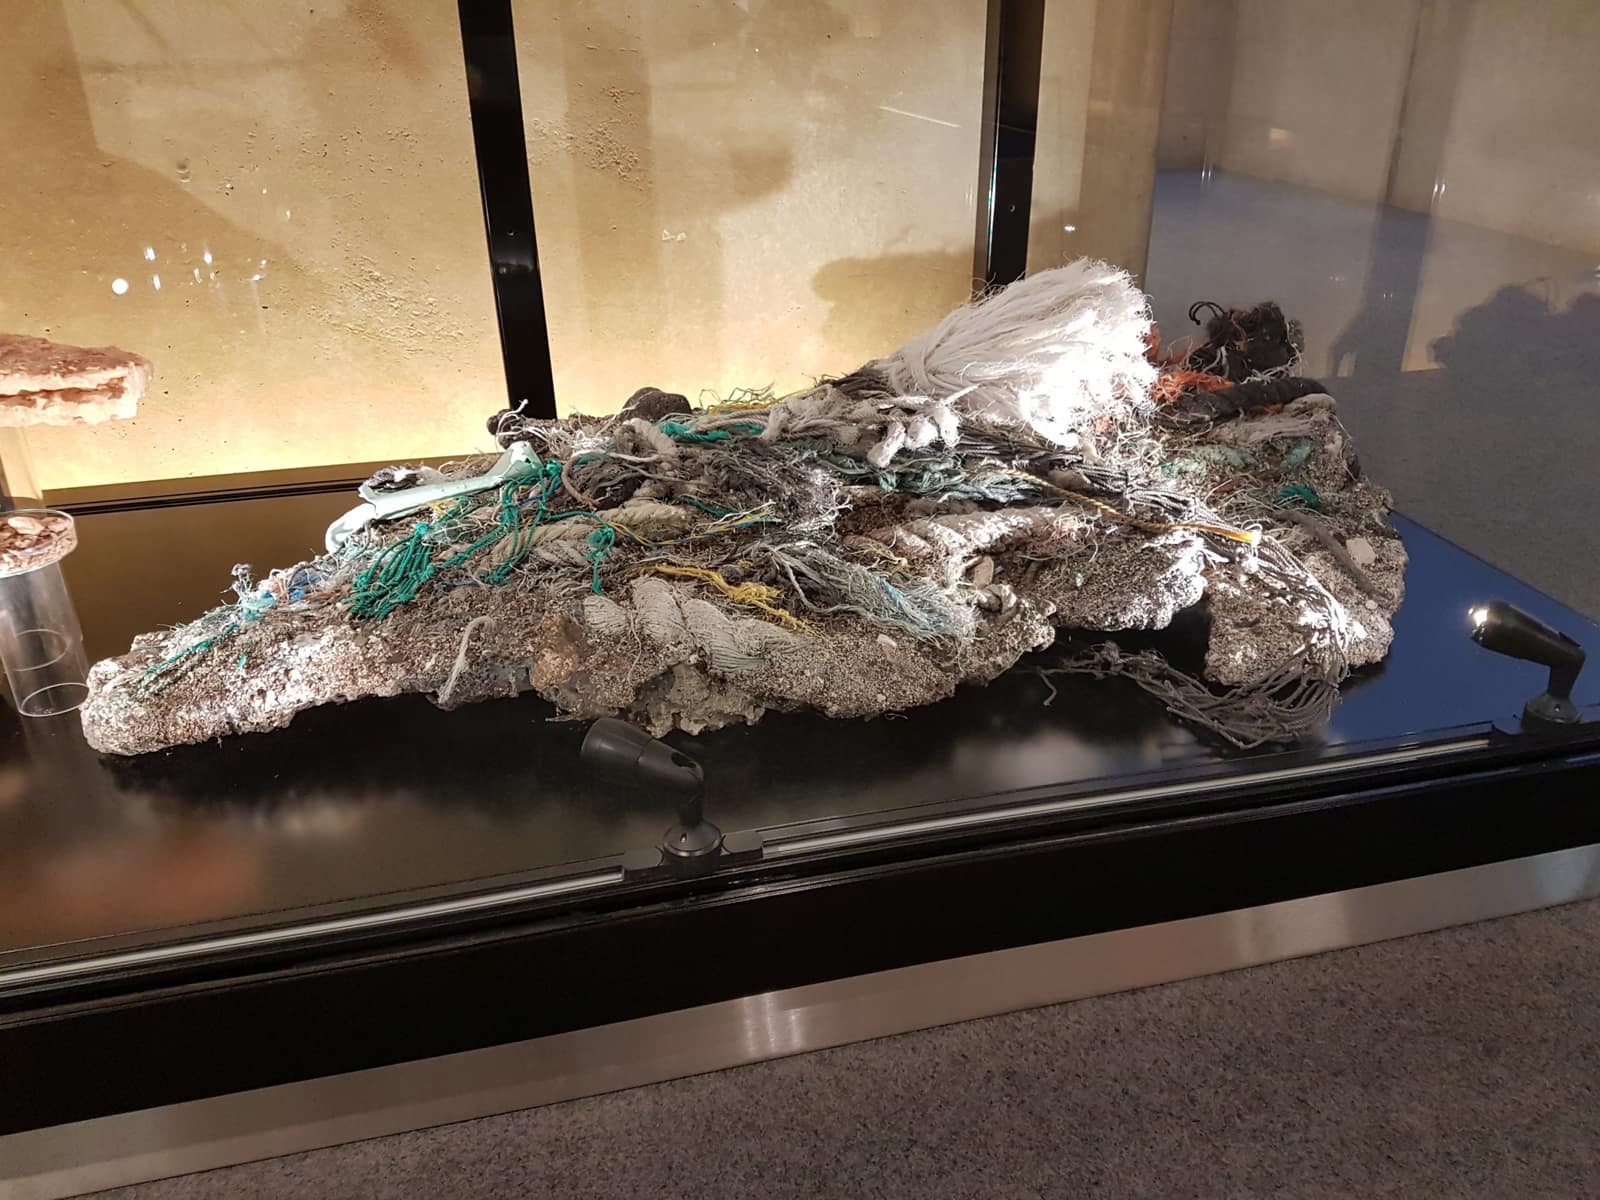
before 2014
Plastiglomerate from Kamilo Beach: a stone of our own making
Kamilo Beach, Hawai'i Island, Hawaii, United States · Oceania
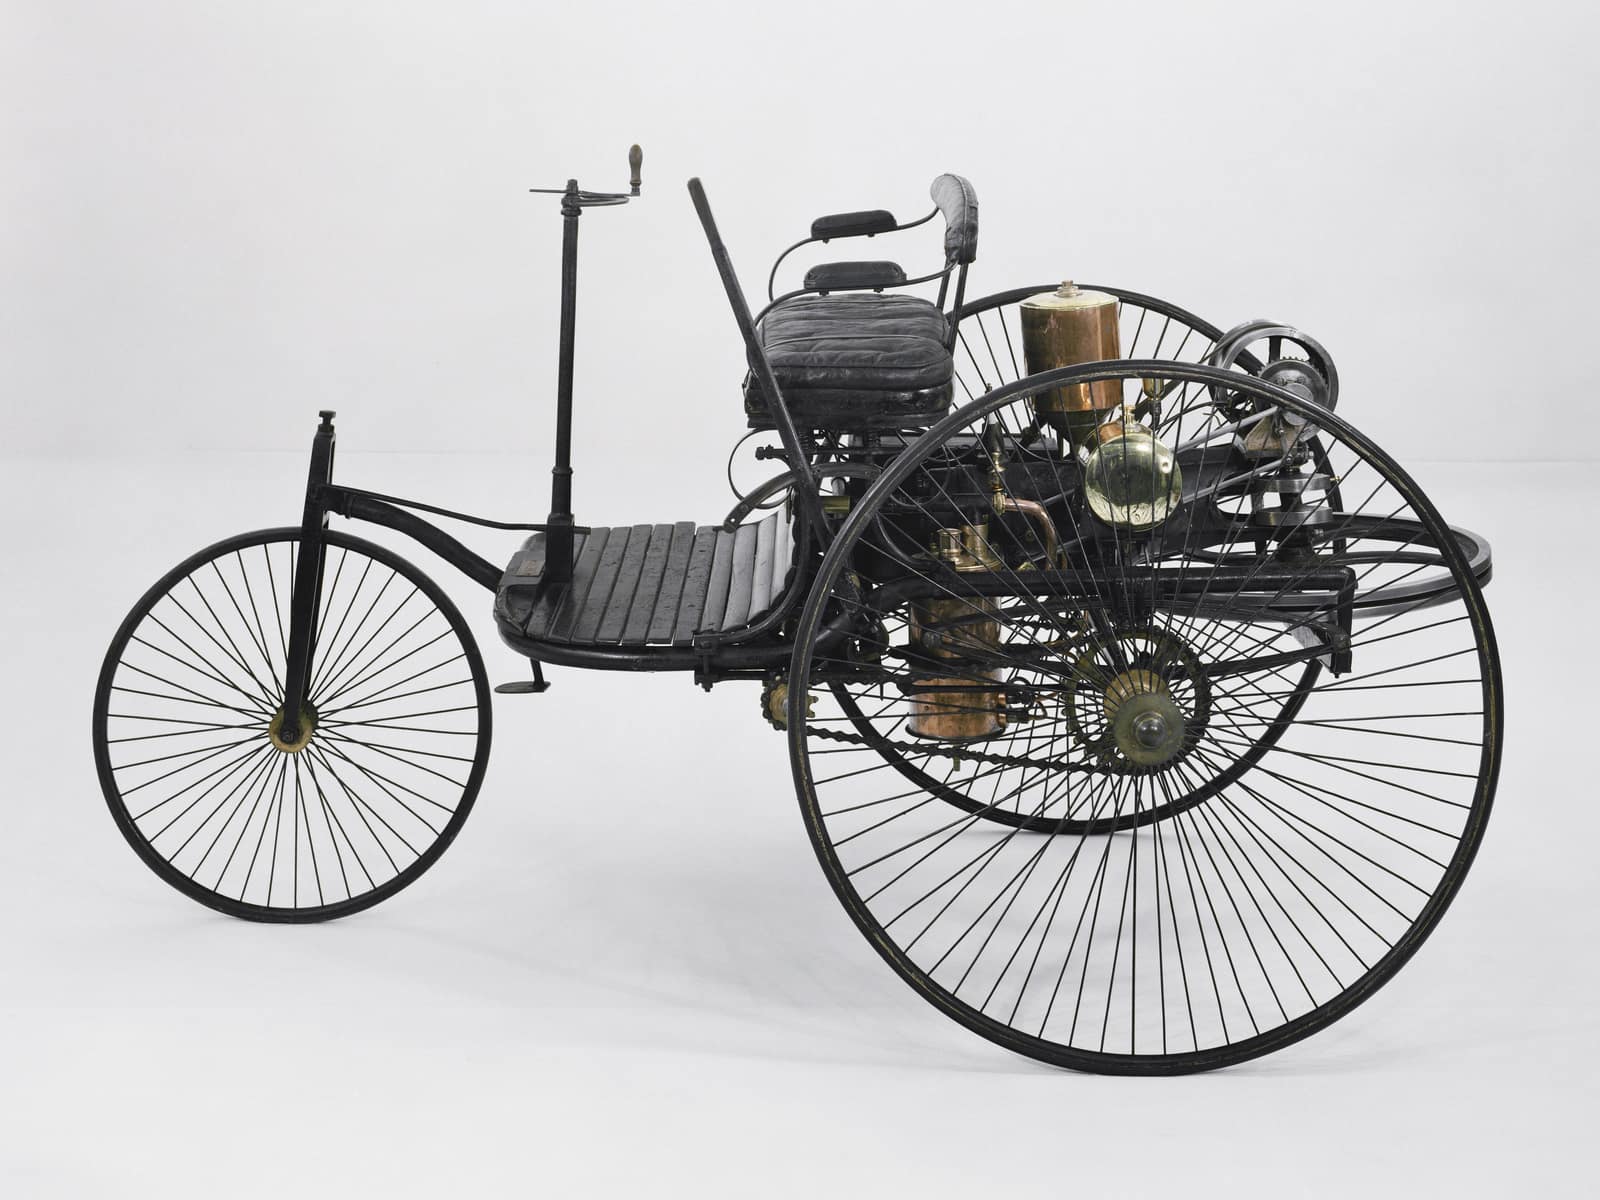
1886 to 1888
Three wheels and a petrol engine: the Benz Patent-Motorwagen
Mannheim, Baden-Württemberg, Germany · Europe